G20 Dashboard
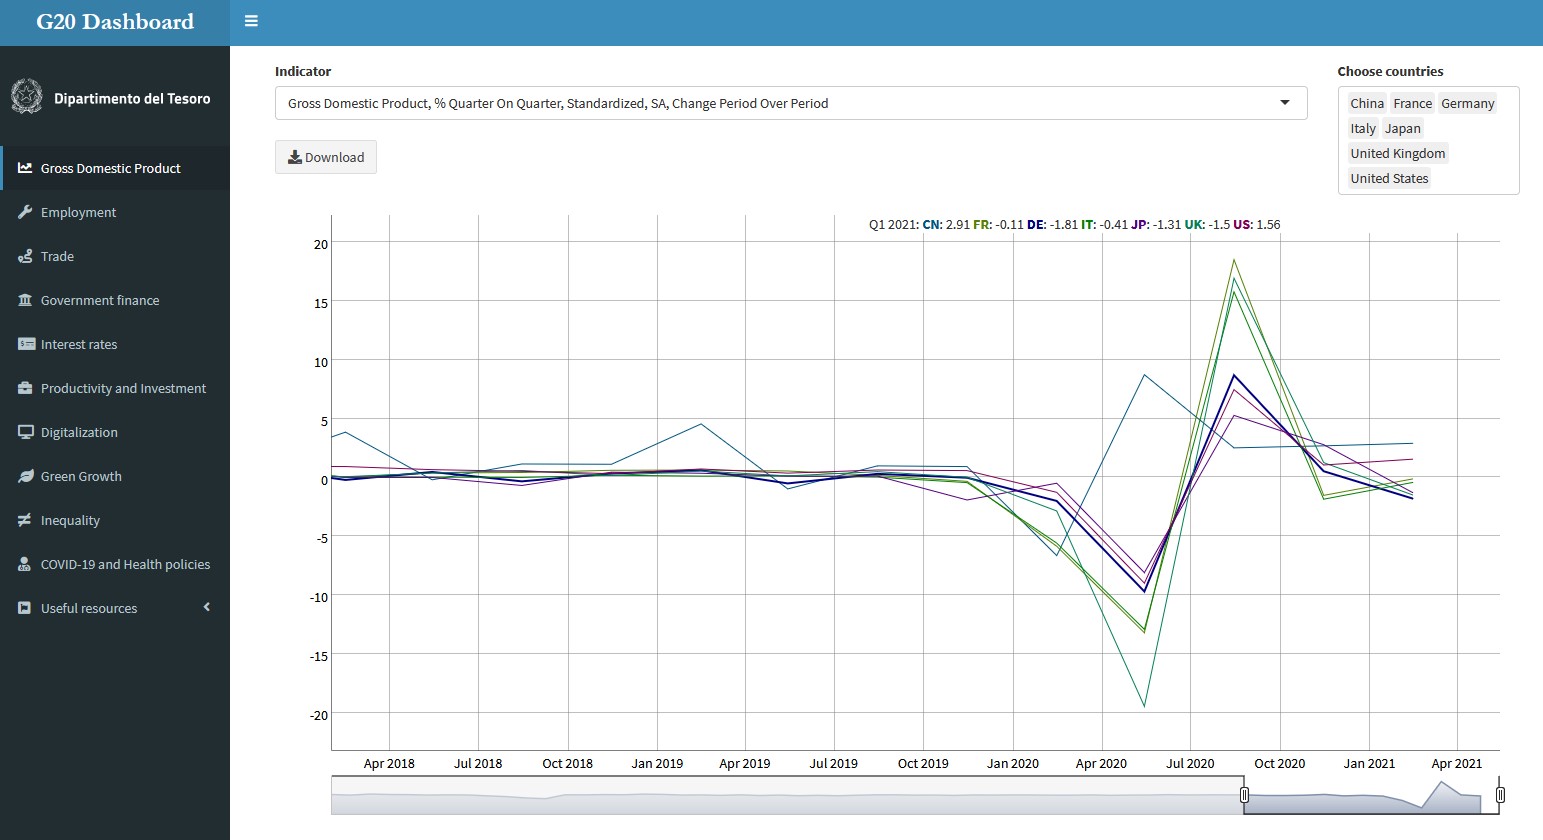
The G20 Dashboard is an online platform developed in R Shiny to retrieve, visualize and download key economic, ecological and health data about G20 countries
During the period spent in the G20 Working Team at the Italian Ministry of Economy and Finance, I developed an interactive web app in R Shiny to retrieve, visualize and download data about G20 countries in the following areas:
- Gross Domestic Product
- Employment
- Trade
- Government finance
- Interest rates
- Productivity and Investment
- Digitalization
- Green Growth
- Inequality
- COVID-19 and Health policies
The G20 Dashboard - available here - retrieves data from Refinitiv Eikon through the Eikon Data API, while the interactive data visualization is carried out with the R package Dygraphs.
The G20 Dashboard is for internal use only and is thus password-protected. However, if you are interested in the project, please feel free to reach out to me and I will be happy to provide you with a demo version and the necessary codes.